Microsoft to come up with a new tool named ‘Clarity’ that will help the site owner to check what visitors are doing on the site while respecting their privacy. Site owners can identify the areas of improvement by checking visitors’ activities, including reporting on the amusingly named “rage click” metric.
Recommendation –
Analytics Tool
Microsoft Clarity is a free tool for the site owners which keeps track of the actions of users interacting with the site. It gives an idea of improving web pages by managing Engagement metrics, website performance data, and debugging information.
According to Microsoft:
Clarity is designed to have a very low impact on page load times, so you can make sure users navigating to your site won’t have to wait for pages to load.
Additionally, we don’t place any caps on your traffic so whether you get 10 visitors per day or 1,000,000, Clarity will be able to handle your traffic with no additional cost for you.
Privacy Features
Clarity is the privacy-focused analytics tool that helps the owners of the site to record the data without violating user privacy.
Microsoft Explained:
We are GDPR compliant as a data controller for visitors to our site and processor for the data gathered by the Clarity script on your site.
The Clarity analytics tool is grouped into three top-level features:
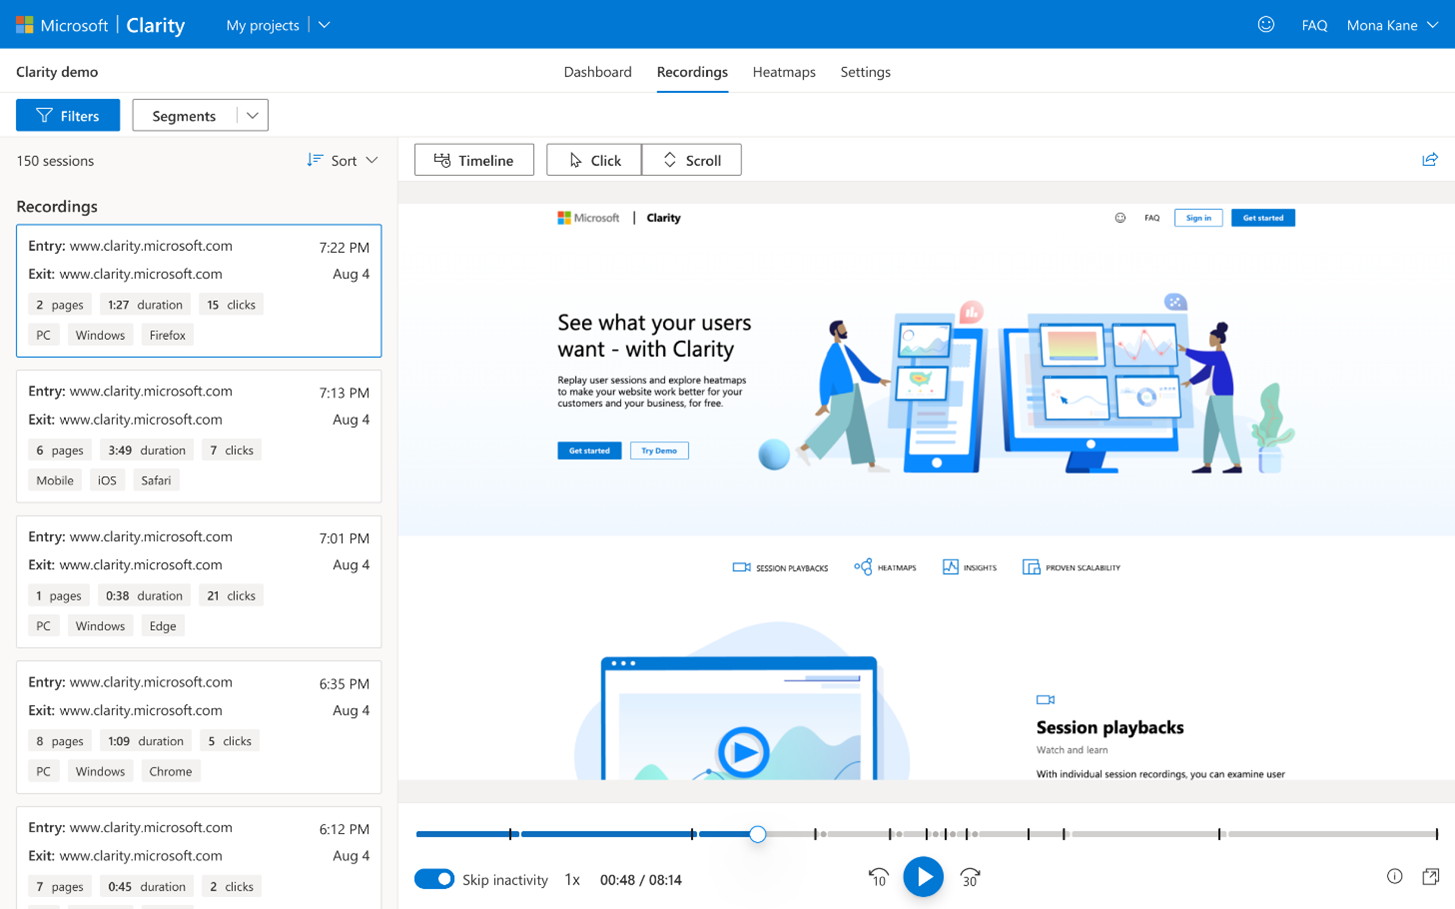
- Session playbacks
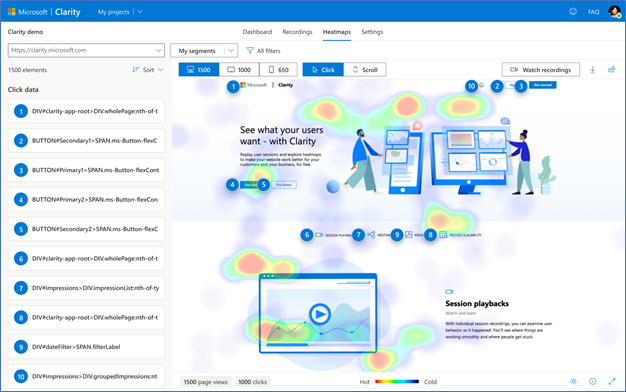
- Heatmaps
- Insights dashboard
Session Playback
HeatMaps
It helps the owner to check where the visitor clicked the most, it is helpful as it hints the owner about which element is clicked the most and how far the visitor visits the page. For instance, if the majority of the clicks are on the tool, it means that people are not scrolling down and it helps to understand why it has happened, why people are leaving the page. Clicks which are closer to the end of the article depicts the highly engaged reader.
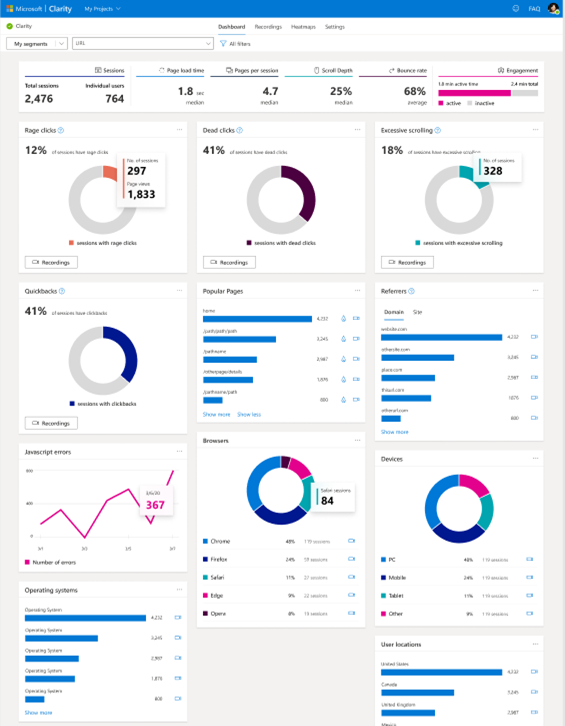
Insights Dashboard
Microsoft Explained:
We provide a dashboard of aggregate metrics to help you get an overall understanding of the traffic on your site. At a glance you will be able to see how many users were clicking on non-existent links or how many people scrolled up and down a page in search of something they couldn’t readily find.
You can also see things like how many concurrent JavaScript errors are occurring across your clients or how much time the average user spends navigating your site.